Cities and landscapes blanketed in a white layer: snowy scenes give Christmas extra charm. But how often does this perfect wintry Christmas scenario happen in North America? In this article, we examine the chances of experiencing a white Christmas in Canada, the US, and Mexico. We’ll also look at climatological trends: Is the likelihood of snow on Christmas Day decreasing across the continent? Whether you’re planning to spend your holidays in a snowy destination or are just curious about snowfall trends near you, we’ve got you covered.
Check the white Christmas probability in Europe here.
All data and content are provided by the author, ensuring content quality and accuracy. While the text is written by the author, AI tools have been used to refine some sentences. All content is thoroughly checked by the author. Website’s terms and conditions apply.
To figure out the chances of a white Christmas in North America, we used ERA5 reanalysis data. We’re focussing on snow cover on the 25th of December, the main day for Christmas celebrations in Canada, Mexico, and the US. We’ve picked 21 UTC for our examination, which represents 4 PM Eastern Standard Time and 1 PM Pacific Standard Time. Also, the way we define a ‘white Christmas’ here is a bit different from our Europe study. We’ll explain this into more detail in the ‘methods’ section at the end of the article.
Odds of a white Christmas in North America
The chances for a white Christmas in North America vary strongly from north to south, with odds for a snow cover on Christmas Day generally being higher in the North, as shown in the figure below. However, elevation also plays a crucial role, with higher mountains also showing increasing odds for a snow blanket on Christmas.

White Christmas probability in Canada
Most of Canada, in terms of land area, almost always sees a white Christmas. But, since most Canadians live in the southernmost parts of the country, their experience varies. In southern Alberta, some areas have a snow probability just under 50%, meaning a snowy Christmas happens about half the time. Around Toronto, the chances also hover around 50%. Vancouver, with its milder climate, has a much lower White Christmas probability (around 10%), though it’s hard to pinpoint this on the map due to the data’s coarse resolution. As you move further north, into the less populated territories and provinces, a white Christmas is virtually certain.
White Christmas probability in the US
In the US, snow on Christmas is a sure thing in the highest parts of the Rocky Mountains. We also find high Christmas snow cover probabilities in the far north, reaching values over 80 or 90% regionally along the border with Canada. We see a lower white Christmas probability in a strip from Montana to Kansas.
In southern and coastal states, the chances for a white Christmas plummet to near zero. That means most places in e.g. Florida, Louisiana, Texas, and California rarely, if ever, see snow on December 25th. Interestingly, there’s a tiny light blue spot in southern Texas, near the Gulf of Mexico, indicating a slim 1-5% chance of snow – more on that later.
White Christmas probability in Mexico
In most of Mexico, a white Christmas is virtually unheard of. The chances are zero in the vast majority of the country. However, some mountainous regions in the north occasionally see snow, with the highest probabilities locally reaching up to 30%. But for most of Mexico, a snowy Christmas is either extremely rare or simply doesn’t happen.
Change in snow probability on Christmas Day in North America
Looking back to the climatological period from 1951 to 1980, the picture of white Christmases across North America changes quite a bit. During that period, snow was far more common, as can be seen in the figure below. In Canada, almost the entire country, except for some regions near the U.S. border, would typically see a snow-covered Christmas. In the northern U.S., the odds were also significantly higher, with some states bordering Canada almost always waking up to a white Christmas. In the mountainous regions of Mexico, the area with a non-zero probability of snow was more extensive than it is today. So, while snow was still a rarity in Mexico even then, a larger part of the country had some chance of experiencing it.

Decreases in White Christmas Probability in Northern US and Southern Canada reaching up to 30 %pt
The contrast between our two climatological periods (1951-1980 and 1991-2020) clearly visualizes the changes in white Christmas probability between those two time periods. Most notable are the declines in the U.S. Northeast, like the New England region, and in Canada’s Nova Scotia, where the chances of a snowy Christmas have plummeted by over 30 percentage points. Similar decreases in white Christmas probability can be seen in states like Montana, along the west coasts of both Canada and the U.S., and in Alberta’s southern regions. The decreasing probability is given by red colors in the figure below. The drop in snowy odds in the Mexican mountains is also evident.
A percentage point is a unit of measurement used to express differences in percentages. E.g. moving up from 40 percent to 44 percent is an increase of 4 percentage points (although it is a 10-percent increase in the quantity being measured).

Higher snow probability in southern states?
Contrary to the substantial snow losses in the aforementioned regions, some southern regions, including parts of Nevada and Northern Texas, show an opposite change – an increase in white Christmases. ERA5 is not the only dataset that suggests more white Christmases occurred in the most recent climatological period in southern and southwestern parts of the US. This archive of the National Weather Service confirms that at least in North Texas, more white Christmas events occurred in the later climatological period. This list counts 7 white Christmas events in the latter climatological period (1991-2020), while counting 6 white Christmas events in the 1951-1980 period.
While a warming climate explains the decreasing snow probabilities in the traditionally snowy north, the reasons behind the (minimal) increases in snowy Christmases in the south are less straightforward.
This noteworthy study found a significant correlation between snow frequency in December in the south-central Plains and southwestern U.S. – precisely the area where we see an increase in white Christmases – and El Niño events. The number of El Niño events during both climatological periods is similar, however, the later climatological period did have stronger El Nino events. This could be an explanation for the increased frequency of Christmas snow in these regions.
Another aspect to consider is random yearly variability. Given that white Christmases are historically rare in the southern regions, even a few snowy Christmases due to yearly weather fluctuations can strongly impact the overall trend. In other words, the ‘noise’ of interannual variability could dominate over the ‘signal’ of long-term climate trends. For this reason, one should be careful to attribute these occurrences to climate change.
The white Christmas of Southern Texas: 2004
As promised, I would come back to the faint increase in snow cover probability in southern Texas. Upon first seeing this data, I suspected a data error, as snowfall along the Gulf of Mexico seemed very unlikely to me. I decided to investigate and came across an extremely interesting weather event: the white Christmas of Southern Texas in 2004! This Christmas miracle unfolded as a cold air outbreak accompanied by intense precipitation moved over the far south of the US. The weather system dropped several inches of snow over the extreme southern region of the US, and even parts of Mexico, on Christmas Eve. For those interested in this extraordinary weather event, here is some worthwhile reading material:
- A meteorological study about model performance, forecaster response and public perception on the historic Christmas 2004 South Texas Snow event: https://repository.library.noaa.gov/view/noaa/3828
- And some more interesting reading on this Christmas miracle: https://www.ksat.com/weather/2023/12/05/what-is-the-actual-chance-of-a-white-christmas-in-san-antonio-and-the-hill-country/

Image source: Nasa Worldview
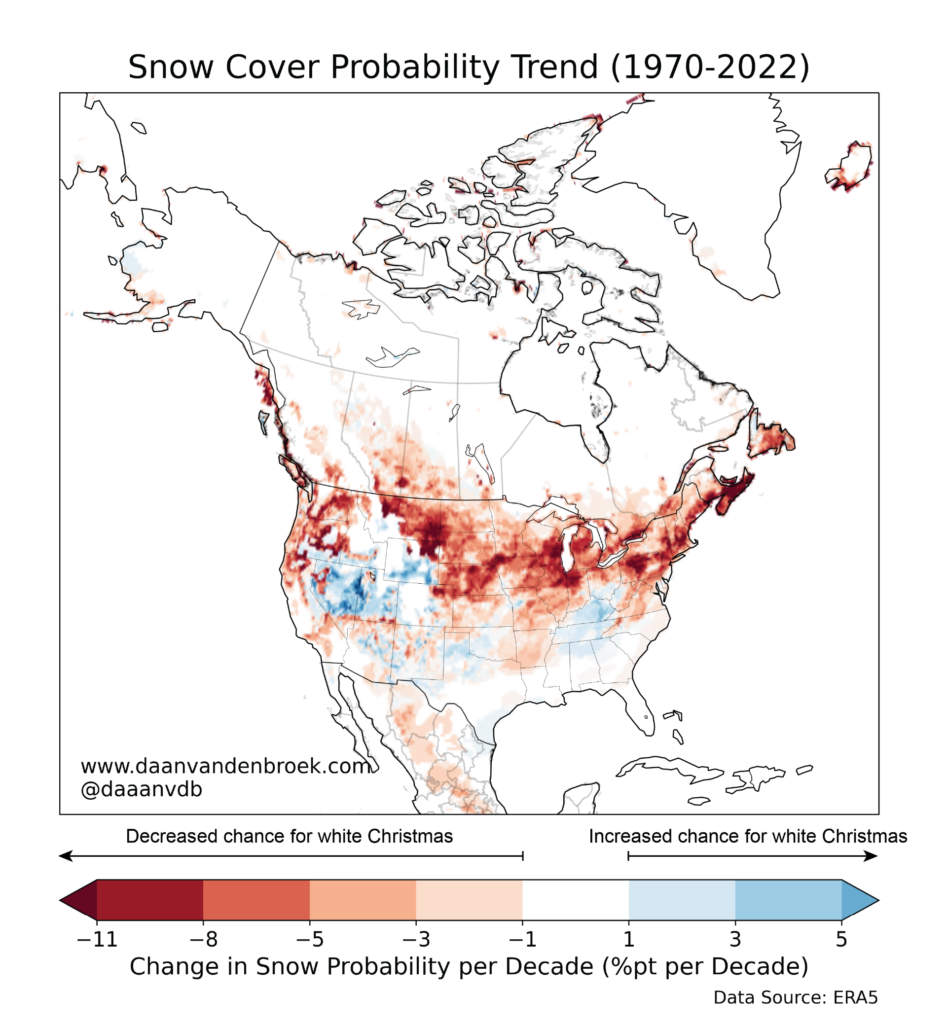
Trends in Christmas Day snow probability US and Canada
Our previous analysis compared snow probabilities between two climatological periods. Although this may be an indicator of a trend, the difference between two climatological period is not exactly the same as a trend. This is because yearly weather variations can substantially influence these periods. To get a clearer picture, we also computed trend lines for snow probabilities across North America for each data point, based on data from 1970-2022.
This method although more indicative of a trend, has its own limitations, which we cover in the methodology section.
What do these trends reveal about snow probability on Christmas Day? In the northern US and southern Canada, the trend toward fewer white Christmases is strikingly strong. Some regions here show a decrease exceeding 10%pt per decade. For the southern states, where we noted a slight increase when comparing two climatological periods, the trend is less pronounced. The signal indicating more frequent white Christmases is still present, as indicated by the blue colors in the figure below, but is considerably weaker than the decline observed in the north.
Conclusion: Snowy Christmases in North America – A Changing Landscape
To conclude, our examination of white Christmases in North America show that probabilities for snow on Christmas are changing. In many places, a white Christmas has become less likely, although the magnitude of the change in likelihood differs strongly by region. For those seeking a guaranteed snowy holiday, much of Canada(‘s northern regions) and the highest peaks of the Rockies are your surest bet, with practically 100% certainty for a white Christmas.
The highest likelihood for a white Christmas in the US can be found in the far north. However, chances for a white Christmas have substantially declined in this region and Southern Canada over the last decades. Mexico remains largely snow-free, with only its northern mountains occasionally witnessing a white Christmas. Snow on Christmas is historically uncommon in the US’ southern states, although there has been a slight increase in this area in recent years, which may be caused by factors such as El Niño. Nevertheless, in a warming climate, the odds for snow on Christmas will likely (continue to) decline across most of North America.
Methods
The ‘Snow Depth’ variable from the ERA5 dataset was used for this analysis. ERA5 is a reanalysis dataset from the European Centre for Medium-Range Weather Forecasts (ECMWF). Reanalysis is a technique combining past observations with modern forecast models to recreate the historical state of the atmosphere.
We downloaded the snow depth variable for the 25th of December at 21 UTC for all available years. The original unit of the data is water equivalent (m). This number was multiplied by 100 (to convert to cm) and consequently multiplied by 10 (assuming a snow water ratio of 10). Our threshold for a white Christmas is set to 1 inch of snow (2.5 cm), as this is the official threshold for a White Christmas by the National Weather Service’s standards (https://www.weather.gov/iwx/whitechristmas). Note that this threshold differs from the 1 cm snow depth threshold we used for Europe. We selected daytime rather than the early morning (as in the official definitions), because people tend to celebrate Christmas in the afternoon in North America. Note that the official definition of a white Christmas in Canada differs slightly, with a threshold of 2 cm counting as a white Christmas.
The trends in each grid cell are determined by applying a linear fit on binary snow depth data. The binary snow depth represents the presence (if snow cover > 2.5 cm, binary value 1 is given) or absence of snow (if snow cover is < 2.5, binary value 0 is given). While linear fits are generally better suited for continuous data and logistic regression might be more appropriate for binary data, the linear fit method was chosen for simplicity and computational efficiency. This approach still offers a decent overall view of the snow cover trends, and can indicate general increases, decreases, or stability over time, though it may be less precise in estimating exact probabilities or changes.